Market Pulse: Q3 2026
Key Takeaways From the First Half of the Year
The end of June marks the close of the sixth month, the second quarter, and the first half of 2026. It has already been an eventful year for investors, with significant shifts in market leadership despite major equity indexes reaching new highs. Leadership within the Artificial Intelligence (AI) trade broadened beyond the hyperscale technology companies toward the semiconductor, memory, and infrastructure firms benefiting from unprecedented capital spending. Meanwhile, the Federal Reserve entered a new era under Chair Kevin Warsh, bringing the prospect of a different monetary policy approach with important implications for financial markets. A resurgent U.S. dollar also emerged as an important macroeconomic theme, while SpaceX took investors on quite a ride, launching the largest IPO in history before its shares quickly came back down to earth.
Several notable themes emerged during the first half of the year that are likely to shape markets going forward. First, geopolitical concerns surrounding the U.S.-Iran conflict eased, with oil prices retreating to pre-war levels. Second, the AI trade continued to strengthen, but market leadership rotated away from many of the "Magnificent Seven" stocks and toward semiconductors, memory, and other infrastructure-related companies supplying the AI buildout. Finally, investors began adjusting to a new Federal Reserve leadership team that appears willing to move interest rates more proactively in pursuit of its policy objectives. As the second half of the year begins, these themes, along with the upcoming corporate earnings season, are likely to play a significant role in determining the market's direction.
The first six months of the year were a reminder that markets do not require calm conditions to perform well. They require confidence that corporate earnings will continue to grow. Investors navigated a new Federal Reserve Chair, renewed conflict in the Middle East, volatile oil prices, persistent inflation, and elevated bond yields. Yet despite these headwinds, major equity indexes finished the first half near record highs, supported by resilient corporate earnings and continued enthusiasm surrounding artificial intelligence.
If 2025 was the year AI became the market's dominant investment theme, the first half of 2026 was when investors became far more selective about where they sought exposure. Capital spending by hyperscalers remained robust, semiconductor demand continued to exceed expectations, and market leadership broadened beyond the largest technology companies to include semiconductor, memory, and infrastructure firms powering the AI buildout. The result was another period of narrow but powerful market leadership, with a relatively small group of AI-related companies accounting for a disproportionate share of global equity gains.
The first half also demonstrated how quickly markets can reprice geopolitical risk. Oil prices initially surged as concerns grew that conflict involving Iran could disrupt shipping through the Strait of Hormuz, fueling renewed inflation fears and prompting investors to reassess the outlook for monetary policy. As tensions de-escalated and the perceived risk of prolonged shipping disruptions diminished, much of that geopolitical risk premium quickly disappeared. Equity markets recovered well before a clear path toward reopening the Strait had emerged. It was another reminder that markets often look through geopolitical shocks unless they result in lasting economic disruption.
How Artificial Intelligence Is Reshaping Technology Leadership
The defining investment narrative so far this year has been fairly straightforward. Investors have favored the companies supplying the infrastructure behind the artificial intelligence buildout, become more selective about the companies funding that investment, and bet that AI-related capital spending will remain elevated for the foreseeable future.
The beneficiaries of this "picks-and-shovels" trade extend well beyond the technology sector, encompassing industrial, utility, and infrastructure companies that support the rapid expansion of artificial intelligence. This quarter, however, we are focusing specifically on technology, as it continues to command the greatest attention from investors and remains at the center of the AI investment theme.
Artificial intelligence remains one of the most powerful drivers of market performance, but the opportunity set is evolving. Capital expenditure (CapEx) continues to be considerable and strategically necessary, yet investors are increasingly shifting their focus away from the magnitude of hyperscaler spending and toward where those dollars are flowing, which companies stand to benefit, and how broadly the resulting earnings growth will spread.
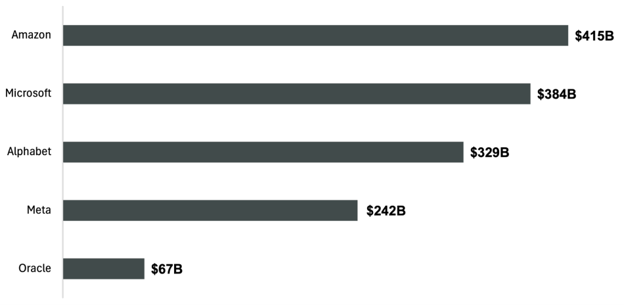
Hyperscalers, the large cloud service providers driving the AI revolution, have dramatically increased capital spending, accelerating the development of artificial intelligence while driving demand across the broader technology ecosystem. Financing this record level of investment has required more than internally generated cash flow alone. Increasingly, these companies have supplemented their spending by issuing debt and raising additional equity. Five hyperscalers alone have committed nearly $1.5 trillion to AI infrastructure since the beginning of 2024.
2024-2026 Cumulative CapEx (Cloud, Data Center, AI Core Infrastructure)
Source: Lord Abbett
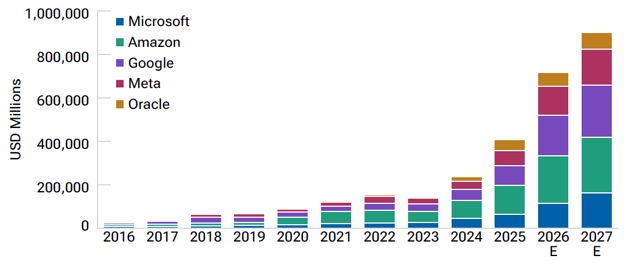
The pace of investment is expected to remain extraordinary, with capital expenditure estimates for 2027 approaching $1 trillion.
AI CapEx Continues to Soar (Trailing 4-Quarter Total)
Source: T. Rowe Price
Despite their enormous investments, hyperscaler stocks have come under pressure as investors have grown increasingly concerned about the capital required to fund the AI buildout. These companies remain among the largest and most heavily weighted constituents of the S&P 500 and have long been the primary drivers of index performance as members of the "Magnificent Seven" (excluding Oracle). As investors became more selective, market leadership shifted away from many of these companies and toward the businesses directly benefiting from their spending.
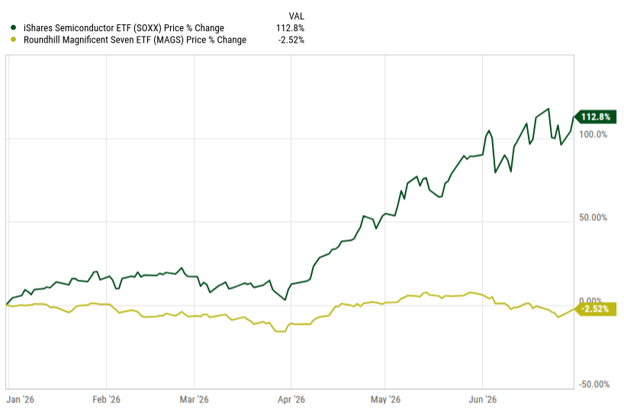
The biggest winners have been AI chip designers, semiconductor foundries, and memory manufacturers, whose products remain in exceptionally high demand as AI infrastructure continues to expand. The resulting surge in earnings has created a dramatic divergence in performance, with semiconductor stocks significantly outperforming the mega-cap technology companies during the first half of 2026.
Semiconductors (SOXX) vs. Big Tech (MAGS)
Source: YCharts
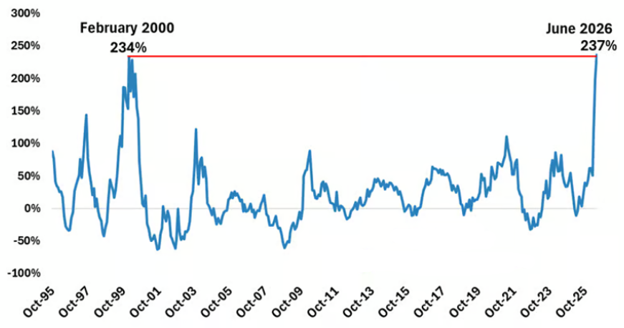
The rally has been historic. Semiconductor stocks have climbed 237% over the past 14 months, surpassing the 234% gain achieved during the peak of the dot-com bubble.
Semiconductor Index (SOX) – Rolling 14-Month Returns (October 1995 – June 2026)
Source: Creative Planning
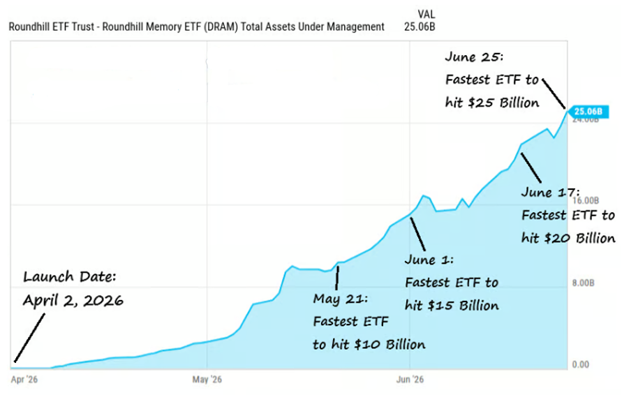
The enthusiasm surrounding the theme has been remarkable. In less than three months, the memory ETF (DRAM) attracted more than $25 billion in investor inflows, becoming the fastest ETF in history to reach that milestone.
Investors Chasing Memory
Source: Creative Planning
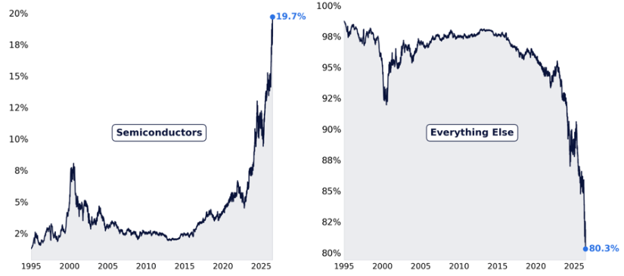
The powerful performance from this investing theme has materially changed the makeup of the S&P 500. Semiconductors now represent nearly 20% of the index, the highest allocation on record and roughly four times their weighting just five years ago.
Semiconductor Weight (SOX) in the S&P 500 Index (Since 1995)
Source: Citadel Securities
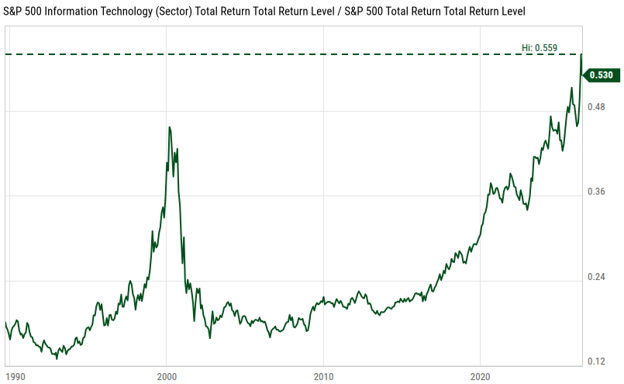
The relentless rally in semiconductor stocks has propelled technology to its largest weighting on record in the S&P 500. Today, technology represents nearly 40% of the index by market capitalization, and its outperformance relative to the broader market has surpassed the previous record set at the peak of the dot-com bubble in 2000.
Tech Outperformance Reaches All-Time High
Source: YCharts
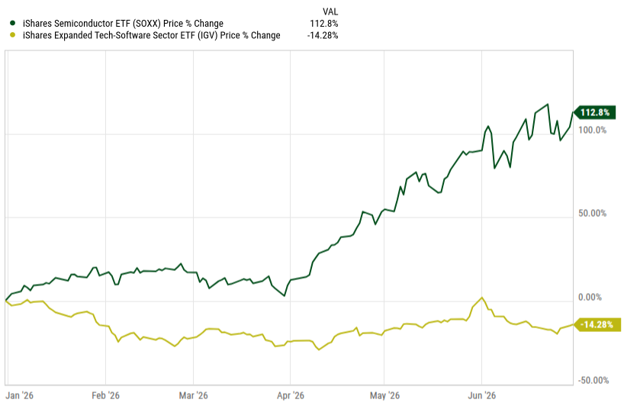
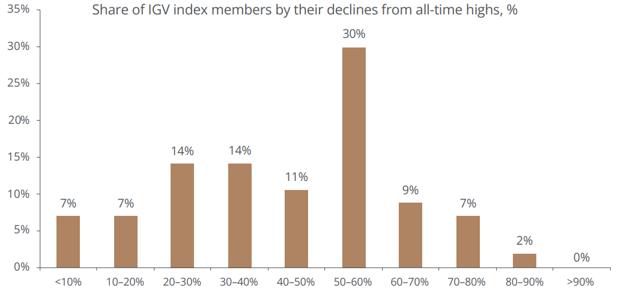
However, the strength has not been uniform across the technology sector. While semiconductor and hardware-related companies have delivered exceptional returns, software stocks have significantly struggled this year.
Semiconductors (SOXX) vs. Software (IGV)
Source: YCharts
The reason software stocks have lagged is that investors are questioning the durability of the traditional subscription-based business model in an AI-driven world. If artificial intelligence allows organizations to accomplish more with fewer employees, demand for software licenses could decline. At the same time, AI may increasingly perform tasks that have historically required specialized software, creating additional competitive pressures across the industry. Some software companies will likely adapt and remain successful over the long term, but for now, the sector serves as another reminder of how quickly market leadership can shift as technology evolves.
Software: There Are Catastrophic Losses Beneath the Surface
Source: JPMorgan Wealth Management, Bloomberg Finance
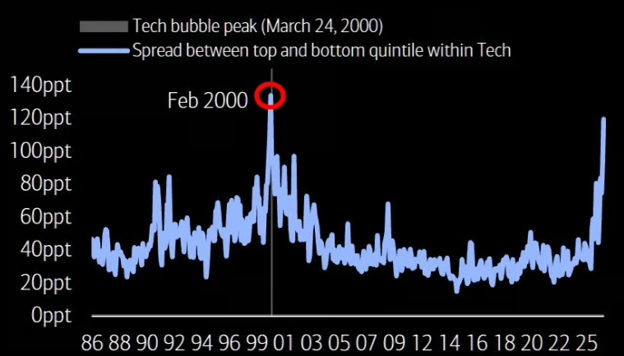
The result has been one of the widest performance gaps ever recorded within the technology sector. The spread between the best- and worst-performing technology stocks is now at its widest level since the peak of the dot-com bubble.
Performance Dispersion Within Technology: Spread Between Median Last 3-Month Return of the Top- and Bottom-Performing Quintile (1986-2026)
Source: BofA Global Research
Artificial intelligence will continue to be one of the market’s defining investment themes, with the technology sector at the center of that story. Whether semiconductor stocks, particularly those tied to memory, can sustain their historic run remains to be seen. As the second half of the year unfolds, investors should gain greater clarity on whether a select group of technology companies will continue to dictate the direction of global equity markets or whether market leadership will begin to broaden.
Looking back at the first half of the year, several key takeaways emerge. First, artificial intelligence continued its transition from a compelling narrative to a measurable earnings driver, supporting elevated valuations for the companies best positioned to benefit. Second, geopolitical shocks remained important but increasingly short-lived, creating volatility without fundamentally altering corporate profits and the economic outlook. Third, higher bond yields and a more hawkish Federal Reserve failed to derail equities as resilient corporate earnings continued to offset tighter financial conditions. Finally, market leadership remained unusually concentrated, with a relatively small group of companies responsible for a disproportionate share of overall index performance.
Looking ahead, the backdrop remains constructive. A resilient U.S. economy, accommodative financial conditions, accelerating earnings growth, and continued investment in artificial intelligence provide reasons for optimism during the second half of 2026. At the same time, we expect performance dispersion to remain elevated, with returns likely to vary significantly across sectors and individual companies rather than lifting the market uniformly.
The Coming IPO Wave
Every few years, a new generation of companies captures the attention of investors and reshapes the market narrative. In 2026, that spotlight is firmly on three high-profile companies preparing to enter the public markets. SpaceX led the way last month with the largest initial public offering (IPO) in history, raising $85 billion and achieving a valuation exceeding $1.7 trillion. Anthropic is widely expected to follow later this fall, with OpenAI targeting an IPO by late 2026 or early 2027.
Together, these three companies could command a combined market valuation approaching $4 trillion. Their anticipated IPO proceeds alone are projected to total roughly $200 billion, an extraordinary figure that nearly matches the $265 billion raised by the 2,749 companies that went public during the entire 1995–2000 period, the height of the dot-com boom. The sheer scale of these offerings underscores both the immense investor enthusiasm surrounding artificial intelligence and space technology, as well as the unprecedented size of today's capital markets.
The excitement surrounding these offerings is understandable, but many investors underestimate how significantly a wave of large IPOs can affect the broader market. With three of the largest and most highly anticipated companies potentially coming to market within a relatively short period, we believe the influx of new equity could temporarily outpace investor demand. Simply put, when supply outstrips demand, prices go down. While bull markets can end for many reasons, including slowing economic growth, rising interest rates, or geopolitical uncertainty, one of the quickest ways to take the wind out of a bull market's sails is an oversupply of new equity.
New equity issuance must ultimately be absorbed by the market. While some investors fund IPO purchases with available cash, many finance them by selling existing holdings to create a source of funds. When several exceptionally large offerings occur within a compressed timeframe, this portfolio reallocation can amplify market volatility. The potential impact is greatest when market liquidity is limited, investor positioning is crowded, or the new offerings compete for capital with sectors that already command significant allocations, particularly mega-cap technology and artificial intelligence.
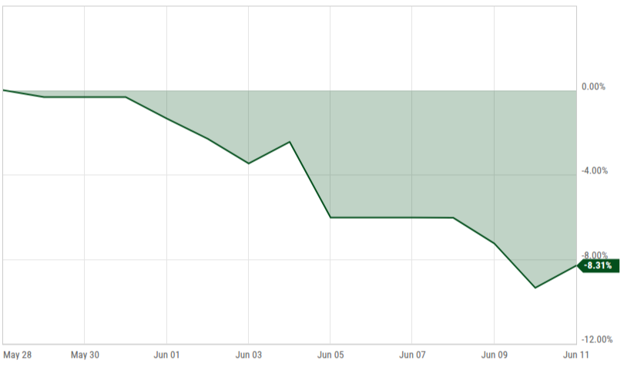
We saw evidence of this dynamic leading up to the SpaceX IPO. Given the record size of the offering, many investors appeared to reduce positions in some of the market's largest and most heavily weighted stocks to free up capital for the new issue. As shown in the following chart, the "Magnificent Seven," the group of dominant mega-cap technology stocks, declined over 8% in the days leading up to June 12, when SpaceX began trading. Although multiple factors likely contributed to the decline, it is reasonable to conclude that some investors reallocated capital away from these stocks in anticipation of the IPO.
“Magnificent Seven” Total Return (May 29 – June 11)
Source: YCharts
Market concentration remains near historically elevated levels, with a small group of stocks accounting for an outsized share of major market indexes. As a result, even modest selling pressure in these market leaders can contribute to heightened volatility across the broader market. In our view, this dynamic represents a meaningful risk to the current bull market. If these exceptionally large IPOs occur within a compressed timeframe, the market may not have sufficient time to absorb each new wave of equity issuance before the next arrives. The sheer scale of these offerings has the potential to increase volatility as investors reposition portfolios to accommodate an unmatched amount of new supply.
There is another important consideration. Because global equity indexes are weighted by free-float-adjusted market capitalization, every major IPO expands the investable universe and alters index weightings. As a result, index funds that track these benchmarks must purchase the new entrant while reducing existing holdings to remain aligned with the benchmark. Given their outsized index weights, the largest companies are likely to be the most impacted, as they become the primary source of funds for these required portfolio adjustments.
What makes this IPO cycle unique is not just the size of the offerings, but the speed with which they can become part of major market indexes. Historically, newly public companies often waited until the next annual index reconstitution before becoming eligible for inclusion. Recent changes to Nasdaq-100 and FTSE Russell rules now allow exceptionally large companies to qualify much sooner. That means the mechanical buying by passive funds, and the portfolio rebalancing it requires, could begin almost immediately after an IPO. Active managers may also face pressure to establish positions because omitting a large benchmark constituent can create active risk. As a result, investors in broad-market index funds could become shareholders of newly public companies far sooner than they would have in previous market cycles.
Taken together, these developments suggest that today's market has several characteristics that were not present during recent periods of heavy IPO activity, including elevated market concentration, record levels of passive investment, accelerated index inclusion, and an artificial intelligence theme already central to market leadership. In our view, these factors could amplify market volatility as investors absorb an unprecedented amount of new equity supply.
Against this backdrop, the potential 2026 IPO wave deserves close attention. It offers public market investors access to some of the world's most recognizable private companies in rapidly growing industries while reshaping major equity indexes more quickly than in prior IPO cycles. At the same time, it introduces a historic amount of new equity supply into a market already characterized by elevated concentration, record passive ownership, and lofty expectations for AI-related growth. Whether the market can absorb this wave of issuance without interrupting the current bull market remains an open question. In our view, a more staggered IPO calendar would give investors additional time to absorb each offering, reducing the likelihood that the cumulative demand for capital creates unnecessary pressure on the broader market.
Beyond the broader market implications of a heavy IPO calendar, investors should also consider how newly public companies have performed after going public. Examining IPO returns during the first year following a company's public debut provides useful perspective on whether buying shares immediately after an offering has generally been a rewarding strategy.
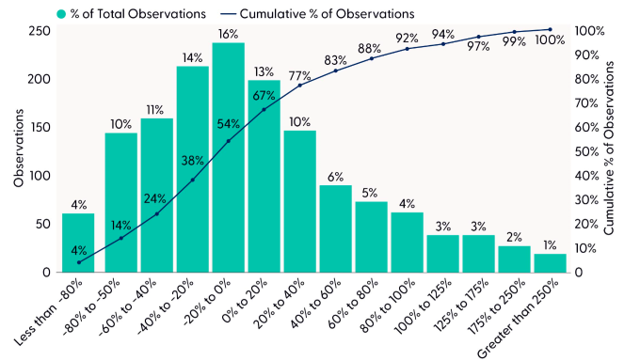
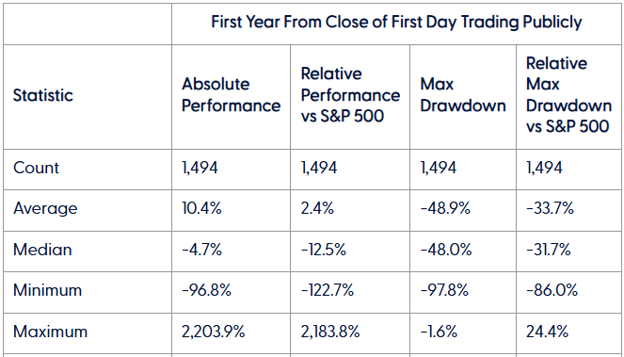
One study of approximately 1,500 IPOs over the past 30 years found that post-IPO performance has been highly variable. Measured from the close of the first trading day, the average one-year return was a respectable 10.4%, but the median return was -4.7%. The gap between the average and median highlights an important reality. While a small number of exceptional winners generated substantial gains, the typical IPO delivered a much more modest, and often negative, return during its first year as a public company.
Distribution of One-Year Returns (From Closing Price of First Day of Public Trading)
Source: LPL Financial, Bloomberg
Perhaps even more important than the ultimate returns was the path investors had to endure to achieve them. During the first year after going public, the average IPO experienced a maximum drawdown, defined as the decline from its peak price to its lowest subsequent price, of 48.9%, while the median drawdown was nearly identical at 48.0%. That means even most IPOs that ultimately generated positive returns typically experienced steep declines during their first year of trading in the public markets.
Summary Statistics From IPO Research
Source: LPL Financial, Bloomberg
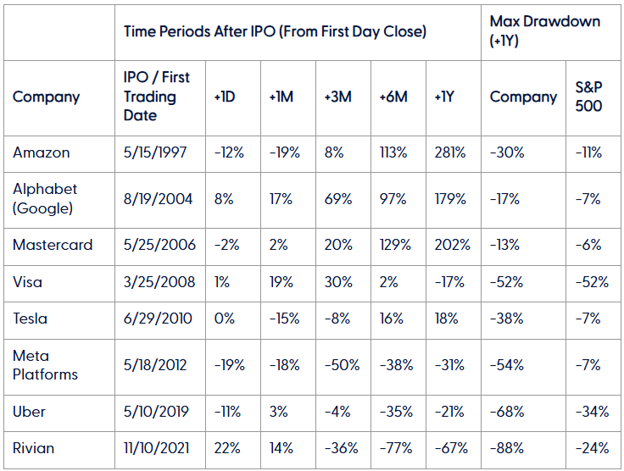
Here is how several of the largest and most recognizable IPOs performed during their first year as public companies.
Performance and Drawdown Statistics
Source: LPL Financial, Bloomberg
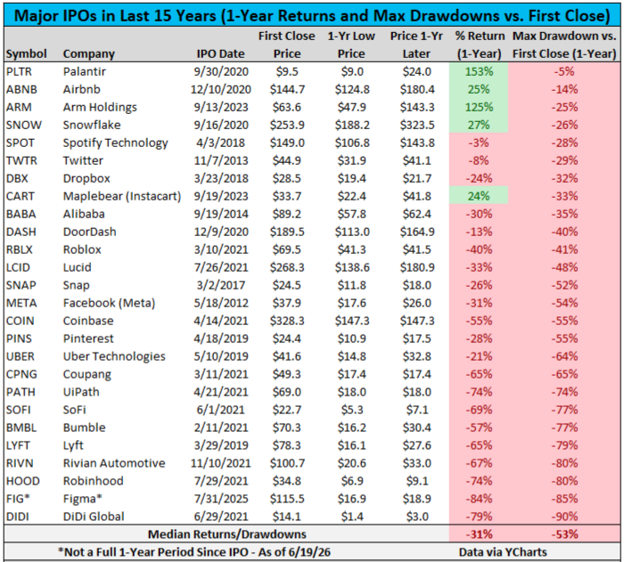
A different study examined many of the largest IPOs over the past 15 years and found that every company traded below its first day closing price at some point during its first year as a public company. Yet, in the months leading up to the SpaceX IPO, one argument was made repeatedly: "This time is different. None of those companies were SpaceX."
Major IPOs in the Last 15 Years (1-Year Returns and Max Drawdowns vs. First Close)
Source: Creative Planning
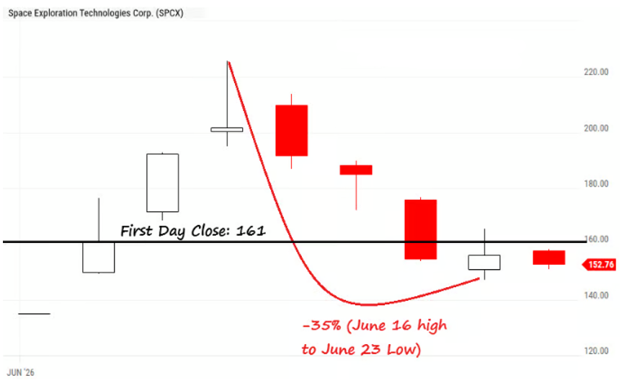
“This time is different." Legendary investor Sir John Templeton famously called those the four most dangerous words in investing. As it turned out, the SpaceX IPO was no exception.
SpaceX Dropped 35% to Below First Day Close
Source: YCharts
Where the stock goes from here is impossible to predict. However, one factor investors should continue to monitor is the significant increase in share supply scheduled to enter the market over the coming months. Large increases in available shares can create additional selling pressure, particularly following high-profile IPOs.
The first major source of new supply will come as insider lockup restrictions begin to expire. Most pre-IPO investors and employees of SpaceX are expected to become eligible to sell after the company's first earnings report, currently anticipated in early August. Additional staggered lockup expirations are scheduled for 70, 90, 105, 120, 135, and 180 days following the IPO. Elon Musk and certain long-term pre-IPO investors remain subject to a longer 366-day lockup period.
The amount of stock that could become available is substantial. The initial public float represented less than 5% of SpaceX's outstanding shares, but by the 180-day lockup expiration, an estimated 58% of shares outstanding could be eligible to trade. Many of these early investors and employees have accumulated extraordinary unrealized gains over the past decade, making at least some level of profit-taking a reasonable expectation. While not all eligible shareholders will choose to sell, the gradual increase in tradable shares represents another source of potential supply that investors should keep on their radar.
New public equity opportunities can be the starting point for extraordinary long-term investments, but the first public price is not automatically attractive simply because the company is innovative. History shows that first-year IPO performance has often been volatile, the median outcome has been negative, and drawdowns have been severe. The coming class may very well include one or more truly exceptional businesses. That still does not mean every new issue will be a compelling investment on day one.
For investors, the framework should remain disciplined. Understand the business, assess the valuation, evaluate the path to profitability, consider the float and lockup structure, and be thoughtful about position sizing. Public markets are exceptionally good at incorporating compelling stories into stock prices. The challenge for investors is determining whether the price leaves enough room for the story to unfold.
A New Era at the Fed
With the swearing-in of new Federal Reserve Chair Kevin Warsh on May 22, he became just the 17th person to lead the Federal Reserve in its 113-year history. Leadership changes at the nation's central bank are rare, and because each transition can have meaningful implications for the economy and financial markets, the appointment warrants attention.
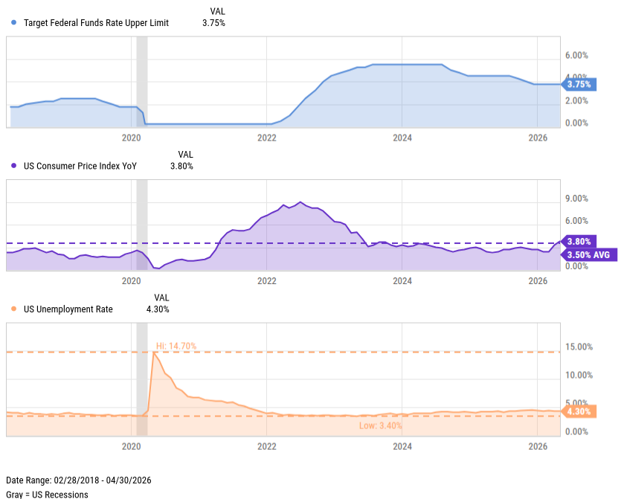
As the Kevin Warsh era begins, the Jerome Powell chapter comes to a close. Powell served as Federal Reserve Chair for eight years, guiding monetary policy through a global pandemic, the sharpest interest rate hiking cycle in four decades, and the most significant inflationary episode in a generation before price pressures eased. Few Fed Chairs have overseen a more eventful period.
While the Chair sets the agenda and helps shape the policy debate, no single individual determines the outcome. Decisions regarding the federal funds rate are made by vote of the 12-member Federal Open Market Committee (FOMC). Although the Federal Reserve directly sets only this short-term policy rate, its decisions influence interest rates across the economy through financial markets. Despite the Committee's collective decision making, history tends to remember the Chair as the public face of the institution, receiving much of the credit when the economy performs well and much of the criticism when it does not.
FOMC Report Card During Jerome Powell’s Tenure as Chair
Source: YCharts
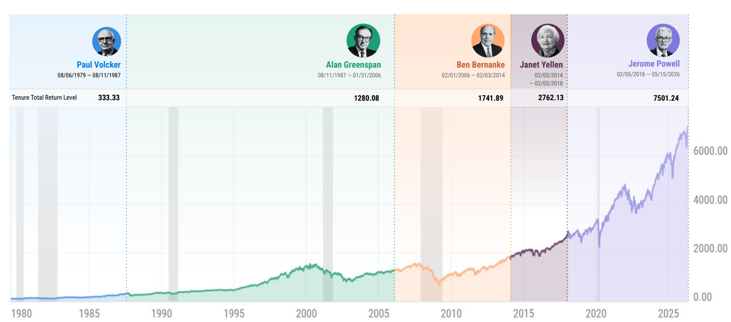
Every Federal Reserve Chair inherits an uncertain economic environment and ultimately faces challenges that could not have been anticipated at the start of the job. Whether confronting the 1987 Black Monday stock market crash, the 2007-2009 Global Financial Crisis, or the 2020-2023 COVID-19 pandemic, Fed Chairs have often been forced to respond to extraordinary events. Yet despite these periods of uncertainty, the U.S. stock market has continued to reward long-term investors. The following chart highlights the stock market’s path during the tenures of the previous five Federal Reserve Chairs, beginning in 1979.
S&P 500 Performance Through Fed Chair Changes (Since 1979)
Source: YCharts
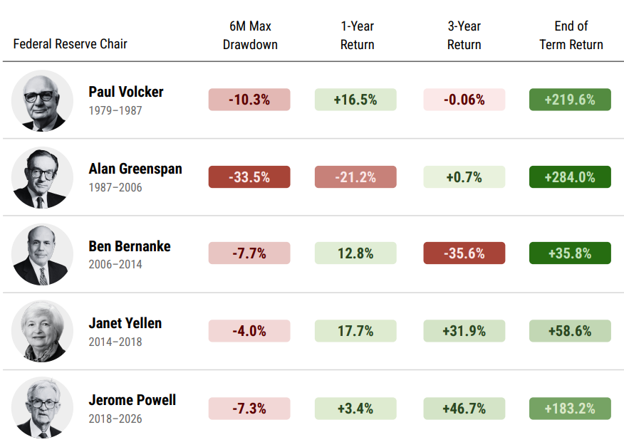
A Federal Reserve leadership transition should not be a reason for investors to abandon a well-constructed long-term investment plan. Periods of uncertainty and short-term volatility are a natural part of every market cycle, but history suggests that disciplined investors are often rewarded for maintaining their long-term perspective. Since Paul Volcker became Federal Reserve Chair in 1979, the S&P 500 has generated a cumulative return of more than 3,840% despite multiple recessions, market crashes, and periods of economic uncertainty.
Investors Need Long-Term Discipline
Source: YCharts
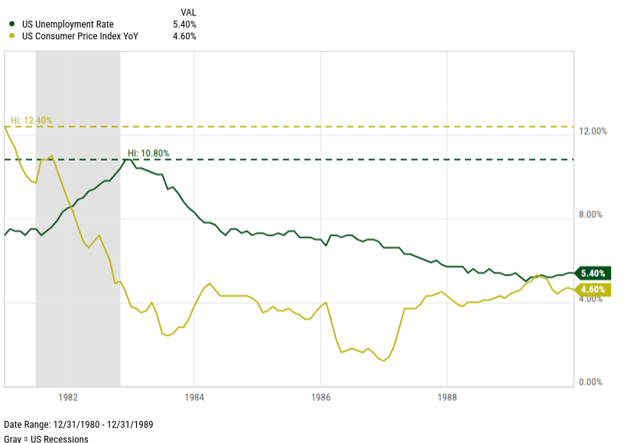
No matter who occupies the Chair, the principle that matters most is the Federal Reserve's independence. History has shown that monetary policy is most effective when decisions are guided by economic data rather than political pressure. A notable example came in 1982, when President Reagan urged Federal Reserve Chair Paul Volcker to lower interest rates as unemployment approached 11%. Volcker held firm, maintaining a restrictive policy until inflation was brought under control, helping lay the foundation for a prolonged period of economic stability. More recently, renewed political pressure on the Federal Reserve has once again raised questions about the institution's independence.
President Reagan Pressures Volcker
Source: YCharts
The broader takeaway is clear. When Federal Reserve Chairs prioritize long-term economic stability over short-term political pressure, households and investors ultimately benefit through lower inflation, more stable borrowing costs, and a stronger foundation for long-term financial planning. Based on Warsh's record and public testimony, he appears committed to that same principle of maintaining the Federal Reserve's independence and making policy decisions driven by economic data.
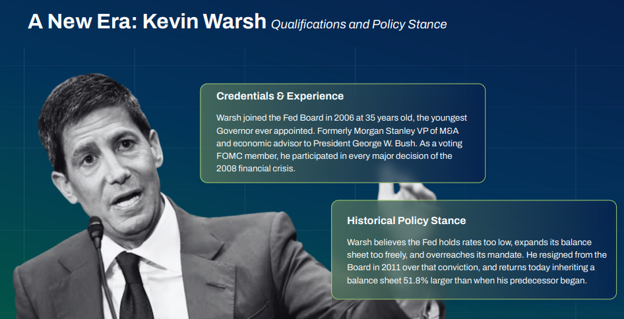
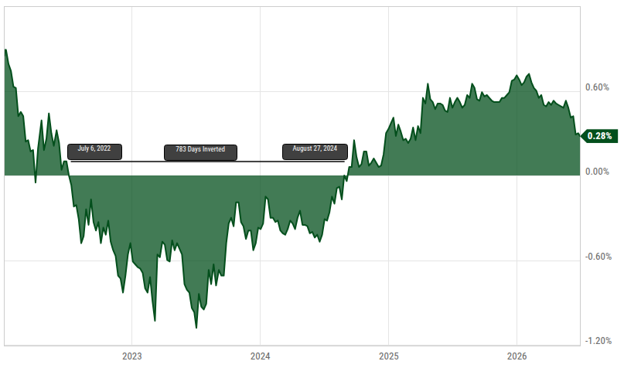
Warsh assumes leadership with the federal funds rate at 3.75% and a 10-year/2-year Treasury spread that spent more than two years inverted before returning to positive territory in August 2024.
10-2 Year Treasury Yield Spread
Source: YCharts
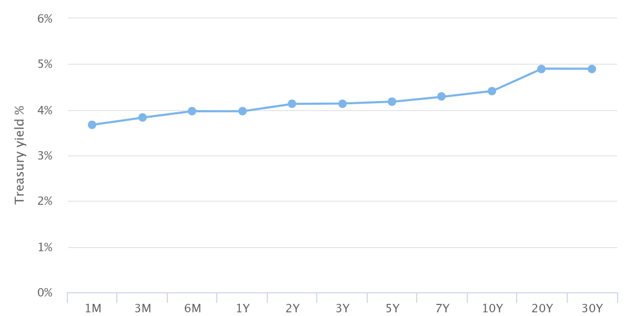
Short duration instruments currently offer competitive yields, but those returns are inherently variable and will reset as monetary policy evolves. For investors with meaningful fixed income exposure, the transition in Federal Reserve leadership is worth monitoring, as future policy decisions will help determine whether today's income opportunities persist.
Treasury Yield Curve (June 2026)
Source: GuruFocus
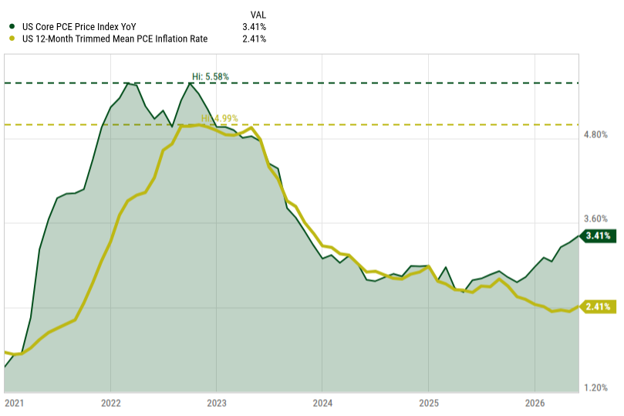
One policy change worth watching is Warsh's view on how the Federal Reserve measures inflation. He has suggested moving away from Core PCE, which has been the Fed's official inflation gauge since 2000, in favor of Trimmed Mean PCE. While both measure underlying inflation trends, the choice of benchmark can influence how policymakers interpret inflationary pressures and, ultimately, how aggressively they adjust interest rates.
Core PCE – Measures consumer prices excluding food and energy, the two most volatile everyday costs.
Trimmed Mean PCE – Measures consumer prices by removing the most extreme price movements each month, essentially, inflation without the outliers.
Preferred Inflation Metric?
Source: YCharts
In conclusion, Kevin Warsh inherits a fundamentally strong U.S. economy characterized by resilient growth and low unemployment, but he also faces persistent inflation risks and an increasingly uncertain geopolitical landscape. Balancing the Federal Reserve's dual mandate of maximum employment and price stability will not be an easy task. Based on his public statements and policy views, Warsh appears prepared to meet that challenge. For the sake of the economy and financial markets, we hope he and the rest of the Federal Open Market Committee succeed in preserving price stability while supporting sustainable economic growth.
Sincerely,
Robert Yarmak, CFA®
Chief Investment Officer / Portfolio Manager
If you would like to discuss your portfolio or have questions about how your investments align with your long-term financial plan, please reach out to your wealth advisor.
Disclosures
Vertrix Wealth Management, LLC is an SEC-registered investment adviser. The information contained in this newsletter is provided for informational purposes only and should not be construed as personalized investment advice or a recommendation to buy or sell any security. All investments involve risk, including the possible loss of principal. Past performance is not indicative of future results. Views expressed are those of Vertrix as of the date of publication and are subject to change based on market and other conditions. Advisory services are offered only pursuant to a written agreement. For additional information about our services, please refer to our Form ADV, available at www.vertrixwm.com or upon request.