Market Pulse: Q4 2026
The Fed Makes Its Move
The Federal Reserve raised its benchmark interest rate by 25 basis points at its September meeting, marking the first rate increase since 2023 and Kevin Warsh’s first policy decision as Fed Chairman. Perhaps most notable was the unanimous 12-0 decision, a sharp change from July’s 9-3 decision to leave rates unchanged. Persistent inflation and higher energy prices tied to the conflict in the Middle East helped bring policymakers together, a significant departure from the internal divisions Warsh faced when he took over, which were the most pronounced since 1992. The unanimous decision to raise rates also reinforced an important message for markets. The Fed intends to set monetary policy based on economic conditions and its mandate, rather than political pressure from the President, Treasury Secretary, or anyone else.
The Return of Rate Hikes
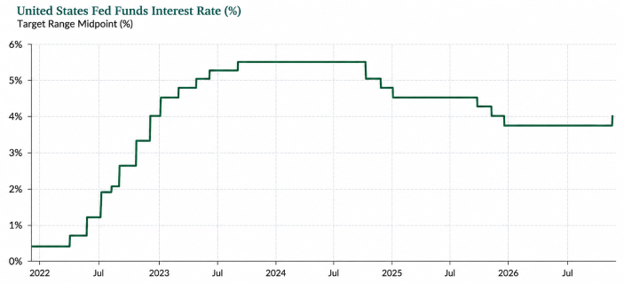
Source: Federal Reserve Economic Data
Markets had largely priced in the September rate hike, making the decision itself less significant than the Fed’s updated outlook for interest rates. The latest dot plot reflected a clear shift in expectations toward a more persistent period of elevated rates. Sixteen of the eighteen officials who submitted projections now anticipate at least one additional rate increase before the end of 2026, while four see room for two more hikes. The median year-end 2026 forecast for the federal funds rate increased to approximately 4.1%, up from 3.75% in June. Looking further ahead, policymakers see rates holding near 4.1% through 2027 before beginning a gradual decline in the years that follow.
Where the Fed Sees Rates Heading
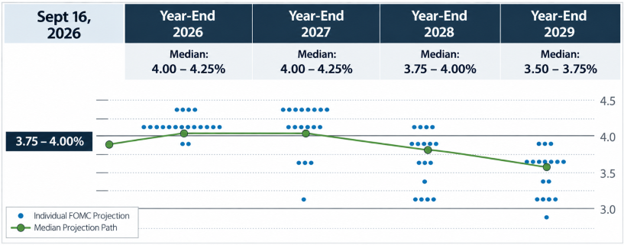
Source: Federal Open Market Committee's Summary of Economic Projections
As Warsh himself put it, “For more than five years, inflation has been running above target. The plain fact is that inflation is too high and has been for too long.” Despite that acknowledgment, the central bank does not expect inflation to return to its 2% target until 2029.
The Fed’s Inflation Outlook
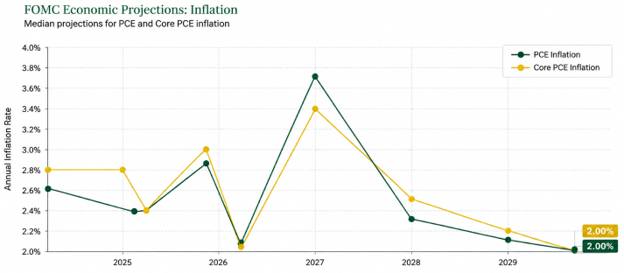
Source: Federal Open Market Committee's Summary of Economic Projections
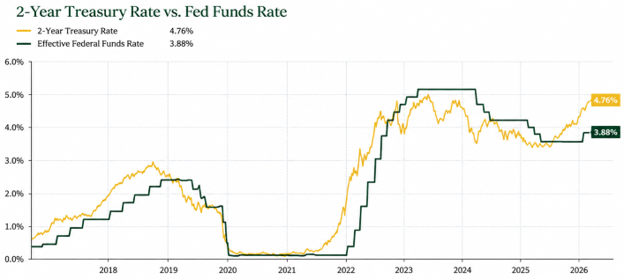
We view the rate hike as a necessary step for Warsh and the Fed as they seek to reinforce their independence and rebuild credibility in the fight against inflation. Unless the conflict with Iran moves toward a resolution and the Strait of Hormuz fully reopens soon, we expect at least one additional rate hike before year-end, an outcome that is also being reflected in the bond market. The 2-year Treasury yield rose to 4.76% following the announcement, suggesting that investors still see the Fed as being behind the curve, with further work needed to bring inflation under control.
More Rate Hikes to Come?
Source: YCharts
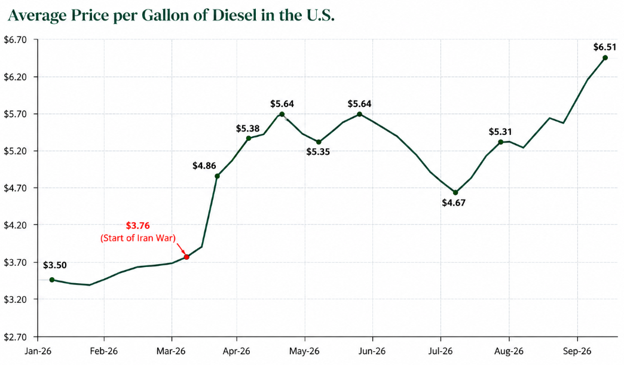
Importantly, the Fed raised its forecasts for both economic growth and inflation while lowering its projection for unemployment. In other words, price stability is likely to remain the Fed’s primary focus, particularly as policymakers view the labor market as being close to maximum employment. That focus becomes even more relevant with diesel prices in the U.S. reaching a record $6.51 per gallon, up 73% from $3.76 at the start of the Iran War. Higher diesel prices will flow through to freight, agriculture, and shipping costs, creating additional pressure on the prices consumers ultimately pay for food, building materials, and everyday manufactured goods.
Diesel Prices: Another Inflation Headwind
Source: U.S. Energy Information Administration (EIA) / AAA
With a new rate-hiking cycle now underway, it’s worth looking back at how the stock market has responded during previous periods of Fed tightening. Since 1990, the Fed has initiated seven rate-hiking cycles, including the one that began with September’s decision. Each occurred against a different economic backdrop and market environment, but the historical record provides useful perspective on how stocks have performed as interest rates moved higher.
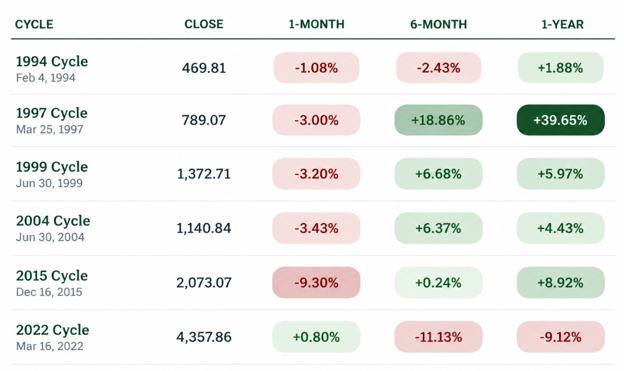
The following table tracks the S&P 500’s closing level on the day each rate-hiking cycle began, along with where the index stood one month, six months, and one year later.
Past Rate Hike Cycles
Source: YCharts
In the immediate aftermath of a rate hike, the market has historically tended to struggle as tighter financial conditions raise concerns about slower economic growth, with 2022 being the only exception. As the time horizon extends, however, the range of outcomes becomes much wider.
The longest rate-hiking cycle began in 2004, when the Fed raised rates seventeen times for a cumulative 425 basis points. At the start of that cycle, the S&P 500 was still more than 25% below its dot-com era highs. The shortest cycle came in 1997 and was barely a cycle at all. The Fed’s only one-and-done 25-basis-point hike was followed by nearly 40% gains in the stock market over the next year. That extraordinary performance, however, was driven largely by the broader dot-com boom rather than the Fed’s decision to move preemptively against inflation. By comparison, the latest hike came with the S&P 500 just 2.73% below its all-time high, the third-closest starting point for a hiking cycle since 1990. Investors will now be watching both the pace and magnitude of any additional moves to determine how this cycle unfolds.
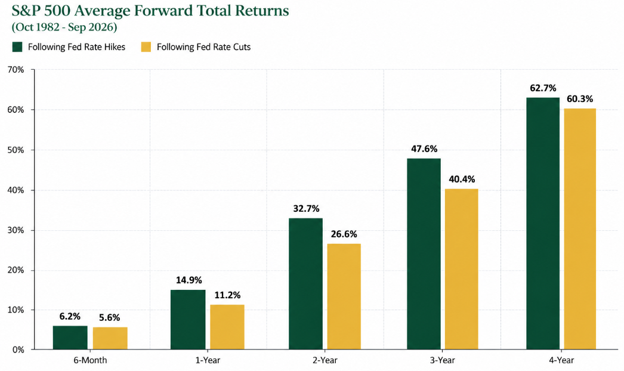
The broader takeaway is that while stocks may need time to adjust to a new interest-rate environment, the historical record does not suggest that investors should abandon the market over the medium to long term. In fact, perhaps counterintuitively, stocks have historically delivered stronger returns following rate hikes than rate cuts since 1982.
Don’t Fear the Fed
Source: Creative Planning
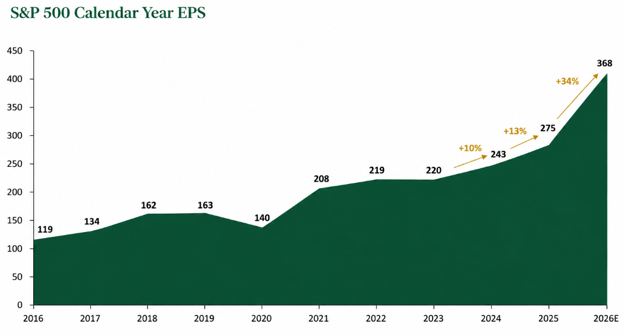
The reason is relatively straightforward. Rate hikes tend to occur when the economy is strong, and a healthy economy typically translates into stronger corporate earnings. That dynamic is playing out today, with S&P 500 earnings now expected to grow 34% in 2026, more than double the 15% growth projected at the start of the year.
Earnings Continue to Climb
Source: FactSet (2026 is estimated)
As for the bond market, short-duration instruments such as 3-month Treasury bills will see their yields adjust almost immediately, as they closely track the federal funds rate. If the Fed delivers just one more hike this year, yields on top cash-equivalent investments could rise above 4% by year-end.
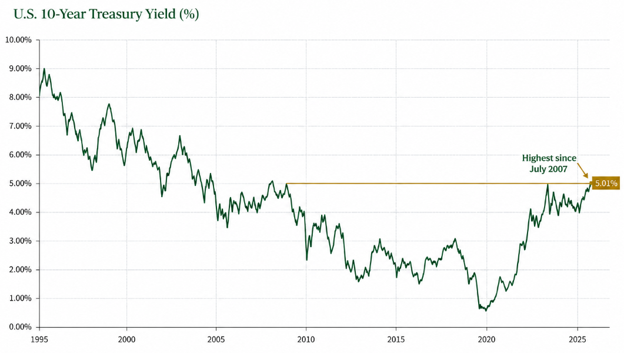
Longer-duration bonds are a different story. Their prices generally move in the opposite direction of interest rates, meaning rising yields translate into falling bond prices and vice versa. So far, that pressure has been to the downside. The 10-year Treasury yield moved above 5% in September, closing at its highest level since July 2007.
Long-Term Rates: Highest in Nearly Two Decades
Source: YCharts
So, will the 10-year Treasury yield rise or fall in response to Fed rate hikes? The answer depends on a number of factors, including how investors view the outlook for economic growth and inflation. The longer the conflict with Iran persists, the longer elevated inflation expectations could remain in place.
Interestingly, the 10-year yield actually rose during the Fed’s rate-cutting cycle in 2024 and 2025. If investors begin to believe the Fed is serious about bringing inflation back under control, we could see the opposite dynamic play out during this rate-hiking cycle, with longer-term yields potentially moving lower even as short-term rates rise.
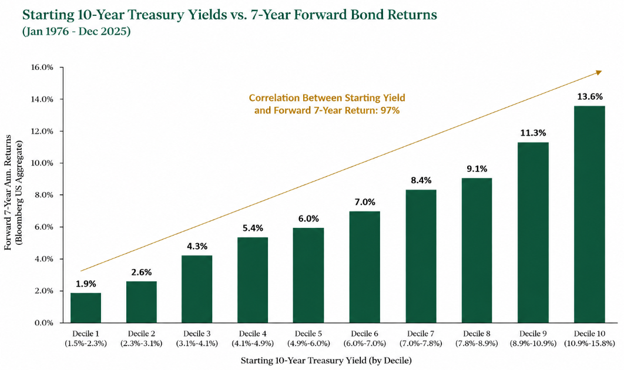
While the bond market has faced a challenging year so far, long-term bond investors should take solace in the following chart. It highlights the historically strong relationship between the starting 10-year Treasury yield and subsequent seven-year bond returns. With the 10-year yield now around 5%, prospective long-term returns are at their most attractive level since 2007.
Higher Starting Yields, Higher Forward Bond Returns
Source: Creative Planning
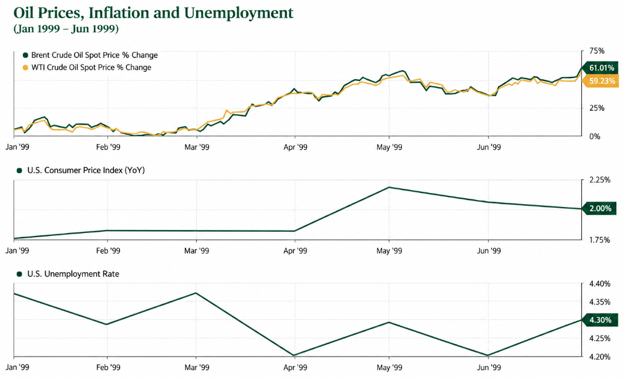
Of the rate-hiking cycles outlined previously, 1999 may provide the closest historical parallel to today’s environment. In both cases, the Fed began raising rates with markets near all-time highs, energy prices climbing sharply, inflation proving stubborn, and the labor market remaining relatively stable.
The similarities extend to the Fed’s policy path as well. In both instances, the rate hike came after three consecutive cuts totaling 75 basis points. Following those cuts, the Fed held rates steady for four FOMC meetings in 1999 before reversing course and raising rates. In 2026, policymakers waited five meetings before making their move.
Echoes of 1999?
Source: YCharts
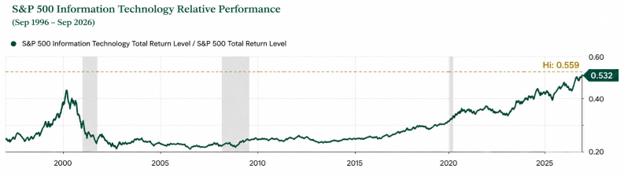
The parallels extend beyond the economic backdrop. In both periods, the technology sector accounted for an outsized share of stock market performance and investor enthusiasm, with artificial intelligence today occupying a role similar to that of the dot-com boom in the late 1990s.
Technology’s Relative Performance: A New High
Source: YCharts
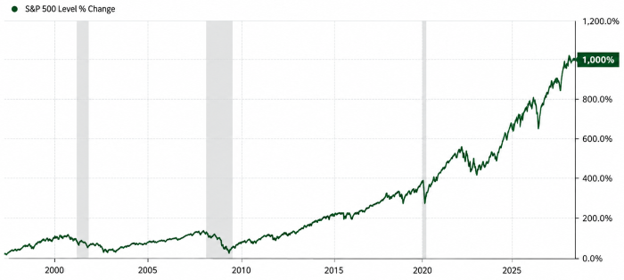
While the themes may be similar, most of the companies driving the performance today are supported by real earnings and revenue growth, rather than the speculation that characterized much of the dot-com era. Continued rate hikes will put that growth to the test, but long-term investors should keep the bigger picture in mind. The market has returned 1,000% over the past 30 years, weathering countless hurdles along the way.
Staying Invested Through the Cycles
Source: YCharts
A single 25 basis point move is rarely enough to define a rate-hiking cycle on its own. What matters more is whether additional hikes follow and, if they do, how quickly they arrive. The conflict in the Middle East remains a key wildcard as the Fed attempts to bring inflation under control without putting unnecessary strain on the labor market.
At this point, the Vertrix Investment Team is not overly concerned that this marks the beginning of a prolonged rate-hiking cycle. Inflation has remained above target for years, and the conflict with Iran has only added to the Fed’s challenge of restoring price stability. Given those pressures, the decision to raise rates was difficult to avoid. Even if another couple of hikes follow, we remain constructive on the outlook for stocks throughout next year. While investors should expect some bumps along the way, the underlying backdrop remains supportive of a potential year-end rally in 2026 and continued market strength into 2027. Economic growth remains resilient, the labor market is relatively healthy, productivity is improving, and capital spending remains strong. There is also a historical tailwind worth considering, as we are heading into what has typically been the strongest year of the presidential cycle, a topic we will explore in the following section.
The Midterms and the Presidential Cycle
Midterm elections have a reputation for keeping investors on edge, and history helps explain why. Markets have generally experienced higher volatility and more muted returns during midterm years. As the saying goes, markets dislike uncertainty, and few periods generate more of it than an election cycle filled with headlines about potential policy changes. As midterms approach, uncertainty around taxes, regulation, government spending, and other policy priorities tends to increase. Investors are left to weigh a broad range of possible outcomes while campaigns put forward competing proposals and forecasts about what could come next.
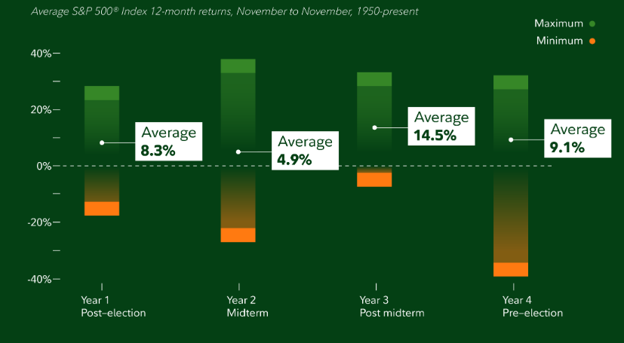
Since 1950, the second year of a presidential term has delivered the lowest average return at 4.9%, while also posting the lowest frequency of positive market performance, with gains occurring in just 55% of those years.
Stock Market Returns and the Election Cycle
Source: Hanover Analytics, Fidelity Investments
That said, 2026 has so far deviated from the typical midterm-year pattern. The S&P 500 is up more than 10% year-to-date as of this writing, putting the market on track for a considerably stronger result than the two most recent midterm years. In 2022, the S&P 500 fell 18.1%, while 2018 saw a decline of 4.4%.
The relatively mild drawdown this year tells a similar story. Since 1950, midterm years have experienced an average drawdown of 16.7%. So far this year, the S&P 500’s maximum decline has been just 9.1%, putting 2026 well below the historical average.
There is another statistic worth highlighting. Since 1962, every one of the sixteen midterm cycles has experienced a market decline between mid-August and Election Day. That’s every cycle, without exception. The average drawdown during this period was 8.1%. As of this writing, the S&P 500 has slipped slightly from its mid-August level, but the decline has been minimal. Whether 2026 can break from that historical pattern remains to be seen.
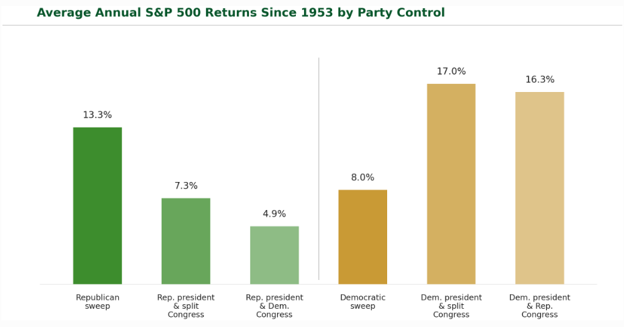
Currently, prediction markets generally point toward the Democrats gaining control of both the House and Senate. From a market perspective, however, investors should be careful not to place too much emphasis on the election outcome itself. Historically, stocks have performed across a wide range of political configurations.
If the current projections play out, or even if Republicans retain control of the Senate, which appears to be a much closer contest than the House, the result would be a divided government with a Republican president and either a Democratic or split Congress. Markets have historically responded well to divided government, in part because political gridlock can limit the ability of either party to make sweeping changes to taxes, spending, or regulation. The result is a system of checks and balances that can constrain major policy shifts and reduce the risk of significant changes in either direction.
Stock Market Performance Under Unified and Divided Governments
Source: RBC Wealth Management
As Election Day approaches, it would not be surprising to see the market struggle to gain momentum or volatility pick up, as both have been common features of midterm years during this part of the calendar. For investors, however, the more important question is what happens after the election and into the following year. If history is any guide, there are reasons to remain encouraged.
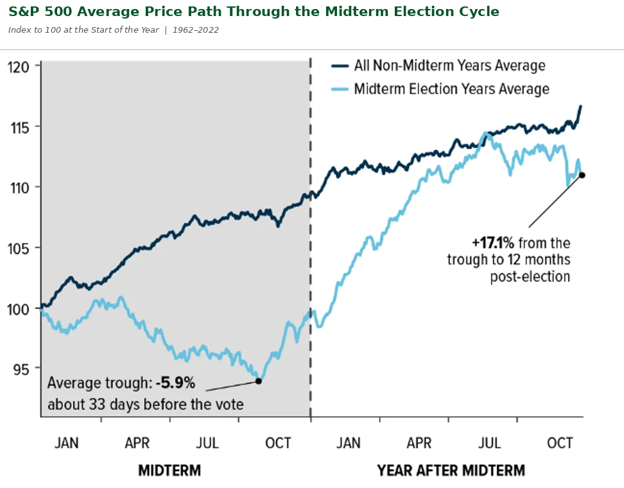
Once the election results are known, markets have historically returned to more normal trading patterns relatively quickly. In many cases, the year following a midterm election has produced stronger than average returns, outside of periods marked by significant financial stress. While every cycle is different, the typical pattern has been for the market to weaken through the summer and early fall, find a bottom in the weeks leading up to Election Day, and then rally into year-end. That pattern could still play out in 2026, although the magnitude of any post-election rebound may be more modest given that the market has already avoided the typical midterm-year decline. Of course, Election Day is still over a month away, and there is plenty of time for the market to take a different path between now and then.
Stocks Have Historically Rallied After the Midterm Elections
Source: Bloomberg, U.S. Global Investors
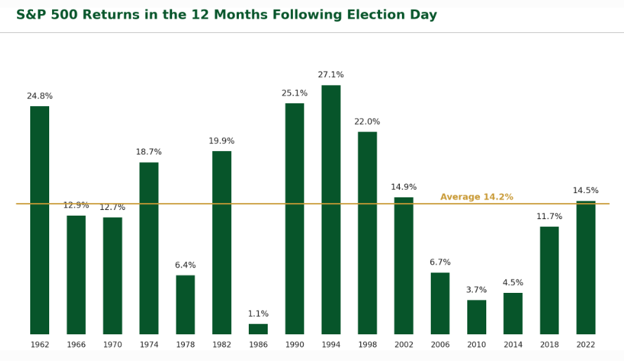
Since 1962, the S&P 500 has finished higher in the twelve months following every midterm election. That is sixteen elections and sixteen positive periods, with an average gain of 14.2%. Even the weakest result, following the 1986 election, was still a 1.1% gain. Remarkably, that 12-month period included the October 1987 stock market crash, yet the S&P 500 still managed to finish in positive territory.
Markets Have Historically Rewarded the Post-Election Year (Since 1962)
Source: Bloomberg, U.S. Global Investors
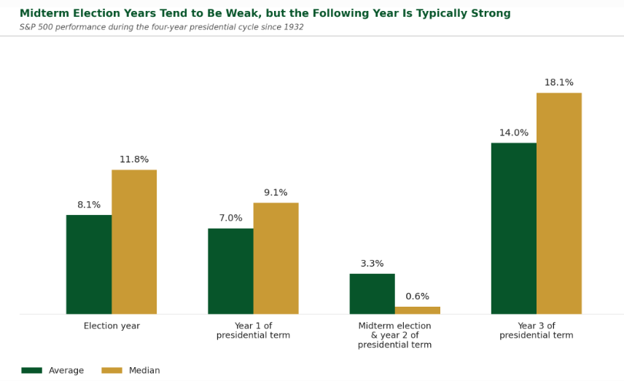
Given this track record, it is perhaps no surprise that the third year of the presidential cycle has historically been the strongest for stocks. The S&P 500 has averaged a 14.5% gain since 1950, as shown earlier in this section, and 14.0% when extending the analysis back to 1932.
Markets Have Historically Strengthened After Midterms
Source: RBC Wealth Management, Bloomberg
No one knows exactly how the stock market will perform through the rest of this year or into next year. What we do have is a long history that provides some perspective, particularly when it comes to the presidential cycle. Midterm elections can influence fiscal policy and investor sentiment, but over longer periods, economic fundamentals tend to matter more. Employment, consumer spending, inflation, interest rates, and corporate earnings provide more meaningful signals for assessing the market environment. Right now, some of those factors are working in the market’s favor, while others present challenges. Rather than making large portfolio changes based on election headlines, investors can account for political uncertainty by maintaining diversification, aligning portfolio risk with their time horizon, and staying focused on their long-term objectives.
Election results may shape the direction of specific policies, but history does not suggest that investment strategies should be built around which party controls Congress. A Vertrix Wealth Management professional can help you evaluate how changing market conditions and policy developments may affect your portfolio and long-term goals.
Sincerely,
Robert Yarmak, CFA®
Chief Investment Officer / Portfolio Manager
If you would like to discuss your portfolio or have questions about how your investments align with your long-term financial plan, please reach out to your wealth advisor.
Disclosures
Vertrix Wealth Management, LLC is an SEC-registered investment adviser. The information contained in this newsletter is provided for informational purposes only and should not be construed as personalized investment advice or a recommendation to buy or sell any security. All investments involve risk, including the possible loss of principal. Past performance is not indicative of future results. Views expressed are those of Vertrix as of the date of publication and are subject to change based on market and other conditions. Advisory services are offered only pursuant to a written agreement. For additional information about our services, please refer to our Form ADV, available at www.vertrixwm.com or upon request.